







Enterprise Reporting Solutions

Reporting that supports executive decision-making. The right numbers. At the right time. In the right context.

Trusted by

Albert Logo
E.ON Logo

Adastra helped us take a broader perspective around our analytics platform. Their team of experts established and implemented a future-proof architecture that enables us to scale our Power BI platform across all Magna divisions globally.

Stefan Tropper

Director, B2B & Solutions, Magna Global IT

I really appreciate the support we are getting from Adastra. Their expertise helped us to deliver many new reports and insights to our business stakeholders in a very fast and efficient way.

Marek Hallér

Manager of Consumer Journey, Business and Consumer Intelligence at Philip Morris International

Reporting is not about charts, it is about confidence in decision-making

We help organizations build reporting that gives management a unified, up-to-date, and clear view of the business, without debates over numbers and without manual work.

6 Enterprise Reporting Challenges Adastra Can Help You With

Different Numbers, Different Conclusions

Management receives conflicting information from different reports and lacks certainty about which figures are correct.

Slow Report Performance

Reports load slowly and respond poorly. Information arrives late, and decisions are made retrospectively rather than proactively.

Meetings Focused on Data Disputes

Leadership discussions revolve around why numbers do not match instead of what actions to take.

Inconsistent Views Across Departments

Finance, Sales, and Operations report differently. There is no single, consistent view of company performance.

Manual and Error-Prone Processes

Reporting depends on Excel, manual work, and key individuals. It is slow, fragile, and difficult to scale.

Lack of Timely Oversight

Management does not have early visibility into risks, performance gaps, and deviations.

Why Adastra

Reporting Designed for Management, Not for Tools

We start with management questions and decision scenarios, not with technology selection.

One Trusted Version of the Truth

We design reporting on top of unified data foundations that stakeholders across the organization can rely on.

Enterprise Experience

We work with complex organizations spanning multiple departments and global operating models.

Built for Long-Term Sustainability

We structure reporting to remain stable and relevant over time, both from a process and technology perspective.

Explore Adastra’s Enterprise Management Reporting
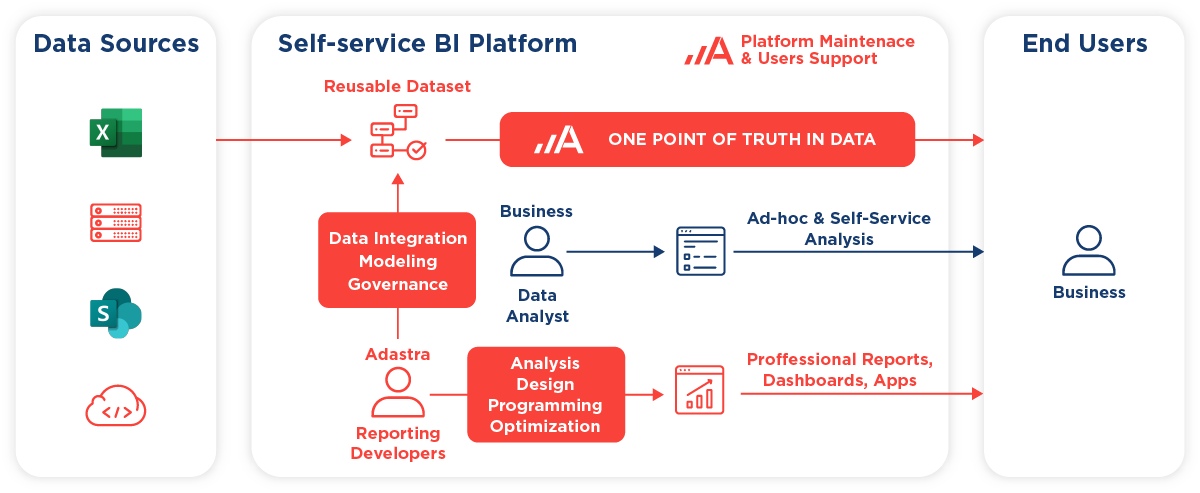
Decisions First

We design reporting around the decisions management actually makes.

  • Key decisions of the CEO, CFO and COO

  • Core questions reporting must answer

  • Metrics with a direct impact on company performance

One Trusted Version of the Truth

We ensure everyone works with the same reliable numbers.

  • Unified KPI definitions

  • Consistent calculation logic

  • Clear traceability back to source systems

Automated and Reliable Reporting

Reporting must operate without manual intervention or dependency on specific individuals.

  • Automated data collection and processing

  • Regular and timely report delivery

  • Reduced errors and manual adjustments

The Right View for Each Management Level

Each level of leadership requires a different level of detail and perspective.

  • Executive reporting for strategic direction

  • Tactical reporting for performance management

  • Operational reporting for day-to-day control

Design for Decisions, Not for Data

Clear layout and a deliberate information hierarchy ensure that users quickly see what matters and understand what drives performance.

  • KPI cards with context, including trend, plan, and variance, without visual clutter

  • Consistent visual standards, minimalist charts, and clear labeling

  • Guided analysis with recommended breakdowns and intuitive drill-down to root causes

Reporting Built for the Future

We design reporting to scale with the organization and remain relevant as priorities evolve.

  • Rapid adjustments based on shifting management priorities, without major rework

  • Straightforward expansion to new business areas, metrics, and data sources

  • Sustainable architecture with scalable performance and controlled maintenance costs

Embrace Data Visualization at Scale

Build a custom data visualization solution that provides immediate access to clear and usable business insights – exactly when you need it.

Enterprise Methodology Made Simple: Adastra’s 8-Step Methodology

1

Initial Alignment and Understanding of Needs

At the outset, we clarify what reporting must solve and who it is designed for.

  • Management objectives and key decision scenarios

  • Current state of reporting and major pain points

  • Expectations regarding speed, scope, and format of outputs

2

Assessment of Current Reporting and Data

We analyze how reporting functions today and where inefficiencies arise.

  • Existing reports, dashboards, and Excel-based outputs

  • Data sources and their quality

  • Weak points such as duplication, manual processing, and delays

3

Definition of the Target Reporting Model

Together, we design what reporting should look like in the target state.

  • Key KPIs and their formal definitions

  • Report structures tailored to different management levels

  • Reporting frequency, timeliness, and delivery format

4

Architecture Design and Delivery Model

We define how reporting will be implemented from both a technical and process perspective.

  • Approach to data consolidation

  • Automation of data collection and processing

  • Roles, responsibilities, and governance framework

5

Proof of Concept

We validate the proposed solution in practice using a limited data scope.

  • Pilot reports or dashboards

  • Verification of data accuracy and KPI calculations

  • Feedback from management and key users

6

Implementation and Rollout

Based on the pilot, we expand the solution and move into standard operations.

  • Implementation of the target reporting model

  • Automation of recurring outputs

  • Extension to additional business domains

7

Driving Adoption and Effective Use

We ensure reporting is clear, relevant, and actively used in decision-making.

  • Involvement of key users in the design process

  • Clear structure and consistent reporting logic

  • Support for changes in how teams work with reporting

8

Long-Term Development and Support

We continue evolving reporting as business needs change.

  • Ongoing refinements and optimization

  • Expansion into new areas

  • Long-term support and operational management

How Does AI Help Build Future-Proof Enterprise Reporting Solutions

Use AI in reporting to accelerate data exploration and simplify navigation. Decision-making remains with people.

Intuitive Queries in Reports, No SQL Required

AI agents allow users to ask questions over data in natural language.

  • Queries without knowledge of data structures

  • Faster orientation within complex datasets

  • Complement to standard dashboards

Rapid Explanation of Changes and Variances

AI agents help identify where and when changes occur.

  • Summary of key variances

  • Alerts on significant shifts

  • Support for deeper follow-up analysis

Navigation and Interaction with Reporting

AI agents simplify movement within complex reporting environments.

  • Guidance toward relevant views

  • Shorter path to critical information

  • Reduced dependency on detailed knowledge of report structures

Supporting Self-Service

AI extends self-service capabilities without increasing complexity.

  • Support for ad hoc queries, allowing users to explore data on demand without predefined report structures or technical knowledge

  • Quick validation of hypotheses directly within the reporting environment

  • Improved access to information for management, ensuring key metrics and insights are always within reach

Data Model Design and Development

AI assists in designing the semantic layer and BI data model.

  • Structural recommendations covering facts, dimensions, and relationships

  • Identification of inconsistencies and redundancies, with performance optimization suggestions such as denormalization, indexing, and partitioning

  • Automatic generation of documentation and data lineage

Secure and Trusted Use of AI

We implement AI with a focus on security, governance, and AI-ready data foundations.

  • Data models and semantic layers prepared for AI use, including standardized metrics, versioning, and data quality controls

  • Operation strictly on approved data sources

  • Alignment with internal policies and regulatory requirements

Success Story

Eurowag Moved Reporting from On-Premise to Microsoft Fabric

Eurowag, a leading provider of integrated mobility and payment solutions for European road transport, was struggling with an aging OLAP cube, dependency on Excel for pivot analyses, and limited scalability to handle reporting peaks.

Adastra helped Eurowag migrate their entire BI environment to Microsoft Fabric, delivering a modern self-service reporting platform that scales on demand and handles hundreds of reports without performance issues.

500+

reports now running on Fabric

500+

users, 70+ of them creating content

2x

capacity scaling during peak hours, multiple times a day

Success Story

SCONTO Nábytek Replaced Excel-Based HR Reporting with Microsoft Fabric

SCONTO Nábytek, a leading furniture and home accessories retailer in the Czech Republic and Slovakia, relied on a fragile ecosystem of interconnected Excel files for HR reporting, resulting in unreliable data, inconsistencies between the two entities, and limited visibility beyond the HR team.

Adastra built a metadata-driven HR Data Mart on Microsoft Fabric — a compact, automated solution fully integrated with Power BI that eliminated manual interventions, enforced data governance, and extended reporting access all the way to the CFO and store managers.

80%

reduction in manual work through automation

2–3×

increase in the scope and granularity of HR reporting

3

days to deploy the fully operational solution

SCONTO Nábytek: Faster HR reporting with Microsoft Fabric — 80% less manual work

Success Story

KUKA Automated ESG Data Collection with Microsoft Sustainability Manager

KUKA, a global leader in robotics and automation, struggled with manual and fragmented ESG data collection across its worldwide sites, lacking unified governance and facing growing regulatory pressure.

Adastra implemented Microsoft Sustainability Manager and built a custom data collection tool that automates ESG data gathering and CO₂ emission calculations across all global sites — delivered in just four weeks.

200+

ESG data points collected from global sites

4

weeks from kickoff to a fully operational solution

40%

targeted reduction in Scope 1 and 2 emissions by 2030

Success Story

Data Integration and Power BI Reporting Support Saves Hundreds of Days Per Year for Philip Morris CZ&SK

In 2019, Philip Morris CZ&SK sought Adastra’s assistance in data analysis, data engineering, and Power BI reporting to streamline data insights for enhanced business development, reducing their involvement in implementation tasks.

40

excel files to sort each month

12+

redesigned Power BI reports

10

newly-developed reports

More Success Stories

Enterprise Reporting Solutions FAQ

Yes, we use best practices to help organizations build visual standards for their dashboards on both a small and large scale.

Yes, we can provide a demo using a variety of technologies and devices. We can also create a pilot or Proof of Concept (PoC) based on your organization’s unique business requirements.

The first step is an initial alignment session, where we clarify management objectives, key decision scenarios, and the main weaknesses of the current reporting setup. We do not start with technology. We start with how the business is managed.

Yes. Most of our projects build on existing enterprise reporting environments. We focus on data consolidation, accelerating reporting cycles, eliminating manual work, and increasing management’s confidence in the numbers.

Initial tangible outputs are typically delivered within a few weeks through a pilot enterprise reporting solution. The pilot validates the approach, KPIs, and report structure before broader rollout.

Yes. We design reporting in a technology-agnostic way. The solution is based on business needs and the existing IT landscape, not on preference for a specific tool.

No. The internal team is involved throughout the process. Our goal is to establish a clear structure, transfer know-how, and enable a sustainable way of working with enterprise reporting.

A core part of enterprise reporting implementation is the unification of KPI definitions, calculation logic, and data sources. The outcome is one trusted version of the truth used consistently by management.

Adastra designs enterprise reporting with management needs in mind and focus on clarity and usability. The engagement includes support during rollout and practical guidance to ensure reporting is effectively embedded into daily decision-making.

Yes. An enterprise reporting assessment or pilot implementation in selected areas is a common entry point. Based on the results, the organization decides if they’d like to expand.

We treat enterprise reporting as a living management tool. We establish processes that allow continuous adjustments as strategy, market conditions, or regulatory requirements evolve.

Mid-sized and large organizations where enterprise reporting directly influences strategic decisions, multiple data sources must be consolidated, and management requires a unified and reliable view of company performance.

Let’s Bring Your Enteprise Reporting at Scale Together