

Data Visualization Services
Build self-service dashboards that provide immediate access to clear and usable business insights.
Trusted by










From an IT operations perspective, the stability of the data warehouse and fast response to any issue are critical for us. Adastra has been supporting our DWH in a way that gives us confidence in daily operations. Thanks to monitoring, we often resolve incidents before users even notice them, and during infrastructure changes, we have access to enhanced support. This is essential for running a retail network of our scale.
Petr Kyzlink
IT Manager Service Delivery Applications Operations
Albert

We already know we'll also want to install these devices in showrooms in Prague and Bratislava because the data shows us a lower percentage of female visitors than male. We need to check whether this is due to a difference in the market, or whether it's data we've gained only from published documents that distort the truth, while reality is different.
Jan Moudřík
Director of Expansion
Alza.cz

When we requested that we shorten the deadline for replacing the DWH by one year, we meant it, in part, as an overstatement. The work was successful mainly due to the fact that the participants did not play their own games, but put literally all their energy and skills into achieving a common end. As a result, we have taken a significant step forward in the key area of BI/DWH, and can effectively support the business of both insurance companies.
Filip Král
Member of the Kooperativa Board of Directors
Kooperativa

The Microsoft Fabric solution has proven to be highly efficient, with remarkably low capacity requirements — delivering tangible added value for SCONTO Nábytek at very low cost.
Petr Maršálek
Chief Financial Officer
SCONTO Nábytek

We started with unified reporting in 2019. Today, more than 5,500 users at Škoda use Power BI, generating hundreds of reports. These allow monitoring of daily production, planning, and personnel capacities at all management levels.
Lukas Jac
Project Coordinator
Skoda Auto
Adastra cooperated with us in an exceptional way, we thank Adastra consultants for their professionalism, support and commitment while constructing this robust data warehouse system with us.
Juan Pablo Onofre
IT Project Manager
Tirecheck

Even though the project had seemed to be quite straightforward at the very beginning, a number of challenges, especially related to the Business Objects reporting infrastructure and data quality, appeared. I appreciate the proactive approach and communication with business users that was undertaken to resolve these issues. The new reports were put into production and this enabled us to switch off the Original Data Warehouse.
Zdeněk Martinec
Head of Management Information and Business Intelligence, Finance
Vodafone Czech Republic
I wanted to acknowledge with recognition that the consulting services that we have received from Adastra thus far are in the upper tier of our expectations and we've been quite pleased with our relationship.
Director, Data and Digitalization
Canadian Energy and Utility Company
The implementation of the AWS Cloud Analytics Platform powered complex insights into our business in an automated fashion. This eliminated the need of manual data manipulations and allowed all business users to focus on our main mission - offer high-quality, affordable healthcare and deliver integrated medical services with compassion and care.
Chris Smith
VP Digital Health
Skylight Health Group
Adastra was a great fit. They augmented the team and helped us establish a strong foothold in our new modern architecture. Honestly, it's like working with an extension of our team. They were in the room for stakeholder workshops and executive reviews, helping us translate business priorities into a practical, scalable AI roadmap.
Sam Wong
Senior Director of Data, Analytics and AI
Mark Anthony Group
Adastra helped us take a broader perspective around our analytics platform. Their team of experts established and implemented a future-proof architecture that enables us to scale our Power BI platform across all Magna divisions globally.
Stefan Tropper
Director, B2B & Solutions
Magna
Make Sense of Your Data
Data visualization helps you identify patterns so you can mitigate risks, streamline your operations and find new opportunities. However, many organizations lack the knowledge and resources to drive maximum value from their visualizations.
Without the right skills and tools, you will have difficulty optimizing your dashboards and providing teams with the accurate, real-time insights they need when making critical decisions.
Transform Data into Decisions for Strategic Business Growth
Accelerate Decision-Making
Enhance Understanding
Identify Opportunities and Risks
Improve Reporting and Communication
Drive Operational Efficiency
Receive Customized Solutions
Collaborate Seamlessly
Leverage Accurate Insights
Trust Your Data, Unite Your Sources
Save Time and Costs, Become Self-Sufficient
Proud partner of






Empower Your Organization with On-Demand, Clear Data Visualization
Unlock Instant Insights
Receive Expert Guidance
Tailored Visualizations
Collaborative Refinement
Compelling Storytelling
Seamless Integration
Embrace Data Visualization at Scale
Build a custom data visualization solution that provides immediate access to clear and usable business insights – exactly when you need it.
Four Steps to your Data Visualization Framework
Plan
We define the project scope, schedule, stakeholders, and success criteria, creating a dynamic kick-off document, RACI matrix, and project status template.
Prototype
Next, we conduct interactive requirements workshops, confirming data elements and defining visual standards to produce a requirement matrix and prototypes of reports and dashboards.
Build and Test
We design and build a production-ready dashboard, actively supporting user testing and quality assurance for a dynamic, production-ready product.
Deploy
Finally, we hold sessions to preserve knowledge transfer artifacts and ensure swift deployment of your new data visualization tools.
Data Mastery at Your Fingertips: Empowering Informed Strategies
Unified Data Solutions
User-Friendly Analysis Tools
Customized Reporting Excellence
Unlock Insights, Boost Productivity and Slash Costs with Self-Service Business Intelligence
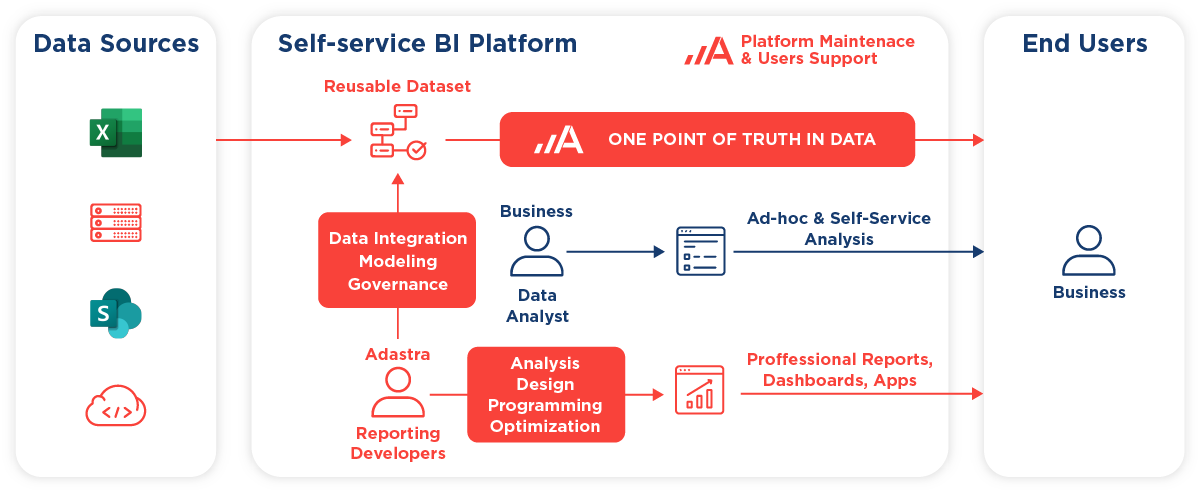
100+ customers trust us with projects on self-service BI platforms, enabling faster decision-making, cost savings, enhanced collaboration, reduced dependency on IT, and more.
Transform your data management with ease and save your organization time with automated monthly reporting.
We support you to:
Create a unified, “single source of truth” for your data
Craft professional and optimized reports, dashboards and applications
Set up data governance and maintain the platform
Educate business users and data analysts on optimal use
Optimized BI Reporting for Every Level of Expertise
End-User Simplicity
Empowered Business Analysts
Advanced Support for Experts

Success Story
Data Warehouse Solution in the Azure Cloud
A North American utility company spent countless hours collecting, curating and cleaning data to prepare it for reporting.
Adastra built a Data Warehouse solution in Azure Cloud that serves as a single source of truth and turns data into actionable insights.
faster regulatory reporting
leaned and governed data
source of truth for all data
Success Story
Data Integration and Power BI Reporting Support Saves Hundreds of Days Per Year for Philip Morris CZ&SK
In 2019, Philip Morris CZ&SK sought Adastra’s assistance in data analysis, data engineering, and Power BI reporting to streamline data insights for enhanced business development, reducing their involvement in implementation tasks.
excel files to sort each month
redesigned Power BI reports
newly-developed reports

More Success Stories


Volkswagen AG
Adastra delivered a cloud-based, hybrid data and reporting platform combining Azure, Power BI, and Oracle DWH.

SCONTO Nábytek
Learn how SCONTO replaced Excel reports with a metadata-driven HR Data Mart on Microsoft Fabric — fast, scalable, and audit-ready.


Eurowag
Eurowag migrated from on-premise reporting to Microsoft Fabric, adopting a tailored architecture that combines Azure Synapse with Microsoft Fabric.
Make Your Dashboards Worth Opening
Let’s review your reporting needs and design visualizations that help decision-makers see what matters and act faster.
Data Visualization FAQ
Yes. Adastra applies visualization best practices to build visual standards for your dashboards, from layout and color to chart choice and navigation. We redesign key dashboards around the decisions users need to make, so information is easier to read and act on, whether you have a few reports or hundreds across the organization.
Yes. Adastra can demo different visualization technologies on a variety of devices, so you see how they work before deciding. We can also build a pilot or proof of concept based on your own data and business requirements, which shows real value and helps you choose the right tool with confidence.
A good visualization answers a specific business question quickly. It uses the right chart for the data, highlights what matters and avoids clutter. Consistent design standards across dashboards help users find information fast. Adastra combines these principles with compelling data storytelling, so insights lead to decisions rather than more questions.
Adastra follows four steps: plan, prototype, build and test, and deploy. We start with your users and decisions, create prototypes for quick feedback, build and test dashboards on trusted data, and roll them out with training. Collaborative refinement throughout the project makes sure the final dashboards fit how your teams work.
Yes, when it sits on governed, trusted data. In one Adastra project, a data warehouse solution in the Azure cloud delivered 8x faster regulatory reporting and 100% cleaned and governed data. Clear, automated dashboards replace manual report preparation, reduce errors and give compliance teams and management the same view of the numbers.
Combine well-designed dashboards with governed self-service and training. Adastra sets up trusted data sources, visual standards and templates, then trains users to explore data and build their own views. Your teams save time and costs, depend less on IT for every change and get answers exactly when they need them.
Adastra works with leading visualization platforms and helps you select the one that fits your data, users and existing technology. We integrate dashboards with your data sources and business applications, so visualizations stay current. The focus is on tailored visualizations your teams adopt, not on a specific vendor or tool.


