
Trusted by

Data-Driven Insights for Strategic Excellence
Unlocking Customer-Centric Insights and Analytics
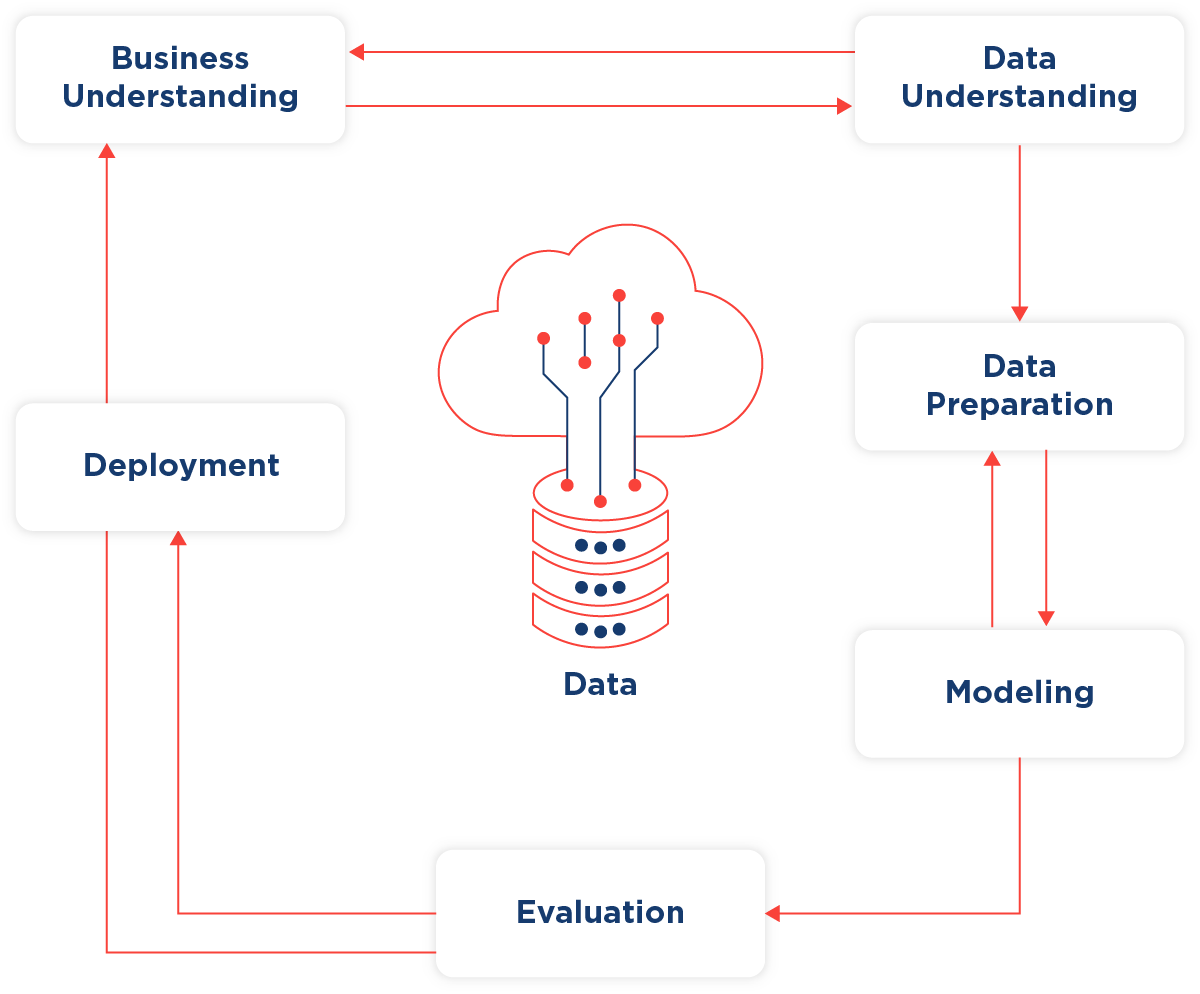
6 Steps to a Tailored Data Science Solution
In our data science projects, we use CRISP-DM (Cross-Industry Standard Process for Data Mining), a widely endorsed, non-proprietary model developed by industry leaders.
It offers an industry-agnostic framework, guiding best practices across six phases:

$1+ Million Savings per Year with AI-Based Image Anomaly Detection
The client’s objective was to modernize and automate the existing manual processes. They brought Adastra in to find a way to compare images from the current runs with those from past successful runs of that recipe of foam and issue alerts if any deviations were found.
Million savings per year
scrap reduction
second report refreshment

Processing Billions of Sensor Data in Less Than 5 Minutes with a Data Analytics Platform
Every second a car is driving, it generates thousands of records from sensors. Our client, a major car manufacturer, was looking to efficiently process these records and present the results in managerial dashboards.
minutes to process and present data in a comprehensible format
serve analytics enabled for all the managers

Reducing Customer Churn by 33% in Automotive
Our client, an automotive company, wanted to increase customer retention and implement additional service and sales recommendations. Leveraging Adastra, and the power of predictive analytics and machine learning, they were able to reveal the rate of customer turnover. They then created custom-targeted campaigns based on customer behaviour, resulting in:
reduction in customer churn
higher campaign conversion rate

Gaining a Customer 360° View for Informed Decision Making
Our client, a major bank in the Czech Republic, wanted to enrich its view of customer data with location attributes, and at the same time, identify branches suitable for closure. We employed advanced analytics and machine learning models—including clustering and spatial analysis—to obtain a 360° view of their customer behavior. We also used data visualization to provide a clear map of the outputs of business departments and managers.
view on customer behavior
visualization easily leveraged by business users
driven decision making enabled on facts instead of feelings
