Insights
Answers, Not Data – That’s What Everyone Wants to Know
November 15, 2016
The opening headline of the article reveals a significant truth: merely having data does not guarantee its effective use. Everyone, starting with the company’s management, seeks specific feedback and answers to their questions. Data alone doesn’t interest anyone. However, it remains a question why the processing of analyses and reports is still seen as a stumbling block in many companies. How can self-service business intelligence (BI) technologies specifically address this issue?
Imagine these scenarios:
Are you preparing an analysis based on data not optimally stored in a data warehouse, resulting in laborious collection via Excel? Is your superior demanding a report by tomorrow, predicting a sleepless night for you and possibly your colleagues due to time spent gathering and presenting data?
Do you need a comprehensive overview of information (like marketing, sales, and financial data) consolidated from various company departments? Are you looking for a simple way to share live, interactive, automatically updated dashboards, instead of sending out static reports? Are you figuring out how to control access to shared reports while keeping track of their usage?
If these situations sound familiar, you are not alone. It’s common among customers to go through a tedious process for each complex analysis or report request: users describe their needs and clarify them with IT staff into specific requirements.
Then comes the struggle over deadlines or costs. If initial steps are successful, users wait for the implementation results, hoping the report arrives on time and as expected. Often, users give up on this procedure and prefer to create reports themselves, leading to the emergence of “reporting” specialists in each department who manually compile their own reports from various sources.
Excel is frequently used for this, eventually creating the well-known “Excel hell” in the company, where no one knows the extent, usage, or cost of these reports. Only when two similar reports, like sales statistics, end up with different data on a director’s desk does the issue begin to be addressed.
Think about the effort to find the “right” data! Wouldn’t you prefer the ability to interact with available data from various sources, not just those stored in the data warehouse?
Self-service BI: Create Your Own Reports Instantly
From the discussion above, it’s clear that many companies have room to improve their methods of processing analyses and reports. Besides standard reports implemented by IT professionals (like financial outcomes or management and owner reports), advanced business users should have access to tools for efficient ad-hoc analysis and reporting, and for sharing these outputs. For business analysts, this means they could focus their energy and time on finding information of interest to management and preparing suitable data presentations (visualizations) instead of tedious manual report processing.
Rather than drafting requirements, they could fine-tune prototypes of new reports with end-users using real data, allowing IT specialists to receive precise specifications. The prototype would then be optimized and, if necessary, transferred to a more robust environment.
In summary, self-service BI technologies enable and offer methods for managing and flexibly exploring data quickly, performing ad-hoc analyses, validating prototypes, and sharing information with minimal IT staff involvement, significantly saving on their time and the department’s operational costs. Business users can handle analysis processing without extensive programming knowledge or specific IT tools.
Working with self-service BI technologies requires only relevant data, which can be visualized through a specific tool to track dependencies, add attributes, and monitor impacts in interactive dashboards. More advanced users can then create a complete “business story,” effectively visualizing data in a way that enables company management to make informed decisions and conclusions.
While this theory sounds appealing, we at Adastra decided to test self-service BI technologies firsthand. We organized a “Power BI hackathon,” where participating teams were tasked with obtaining necessary data for their invented “business story” and learning to use the Power BI Desktop tool.
Over one and a half days, each selected team had time to prepare their dashboards and develop their story into an engaging presentation. The teams then presented their results to management representatives, who faced the tough task of evaluating and rewarding the best teams. However, prizes were not the main draw.
The real value of this activity was expanding our consultants’ knowledge, who invested their efforts into creating six amazing stories supported by a range of dashboards with beautiful data visualizations.
Meet one of these “business stories,” authored by David Lacina and Kuba Starý, consultants at Adastra.
Success Story: Austrian Brewery
The goal of this study was to analyze the business potential of selected global locations for a new brewery. Although the study’s premise was fictional, the data were real, sourced from publicly available information, including beer production and consumption figures, sociodemographic data, and competitive analysis.
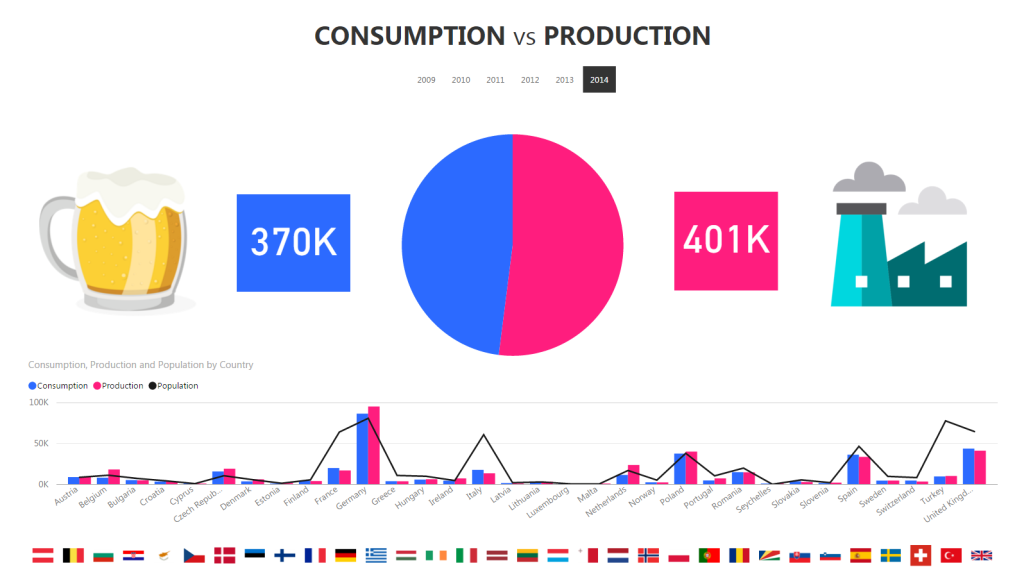
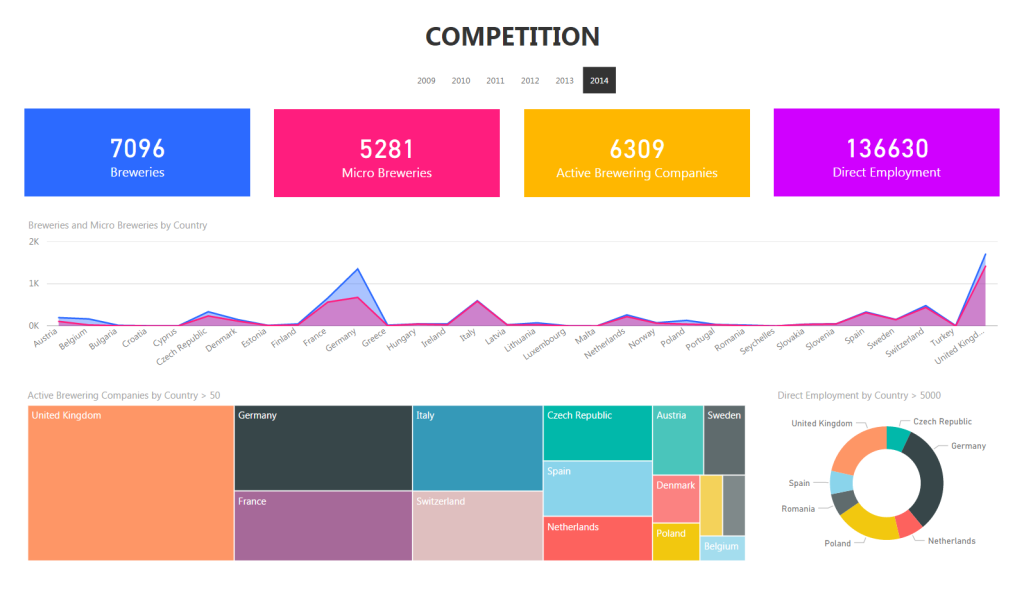
The analysis revealed a nearly twofold increase in competitive pressure in various countries, with a significant rise in microbreweries, especially in England (almost 1000 new competitors).
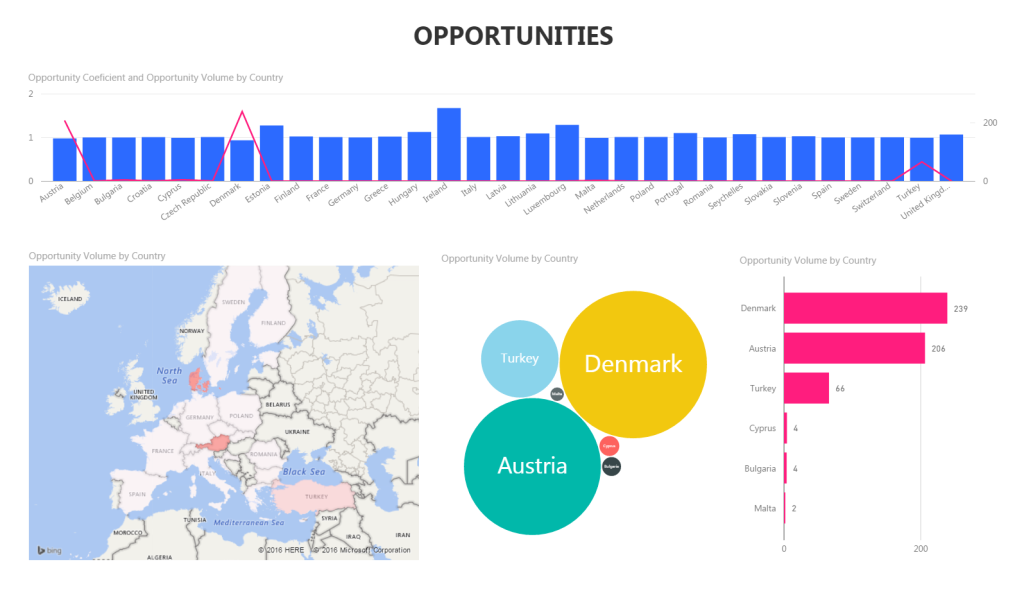
Market opportunity analysis, displayed in another overview, assessed the potential based on a custom coefficient calculated as “(production – export + import)/consumption”. Denmark, Austria, Turkey, and Cyprus emerged as the most promising countries for beer import or production, with coefficients below 1.
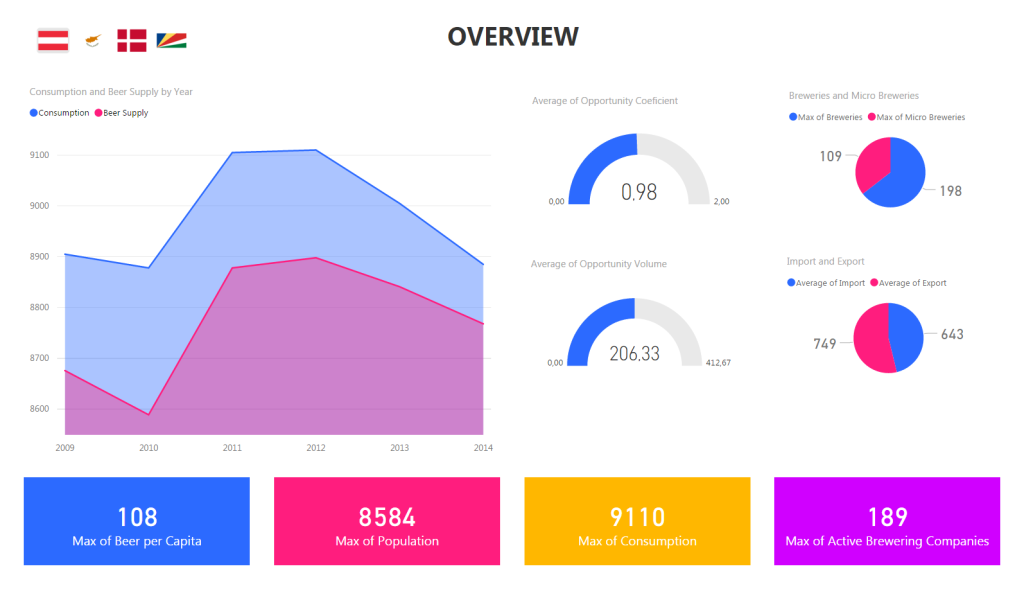
However, upon closer examination, the Danish market appeared relatively unstable. Thus, the Austrian market, ranking second, was identified as the most suitable for starting beer production/import. The “Average of Opportunity Volume” indicator, a custom metric, facilitates the uniform and straightforward evaluation of market opportunities, representing the beer volume (in thousands of hectoliters) that could be produced or imported for the Austrian market.
The potential of this market is also confirmed by the upper left chart, showing a consistent gap between beer supply and consumption in the region.
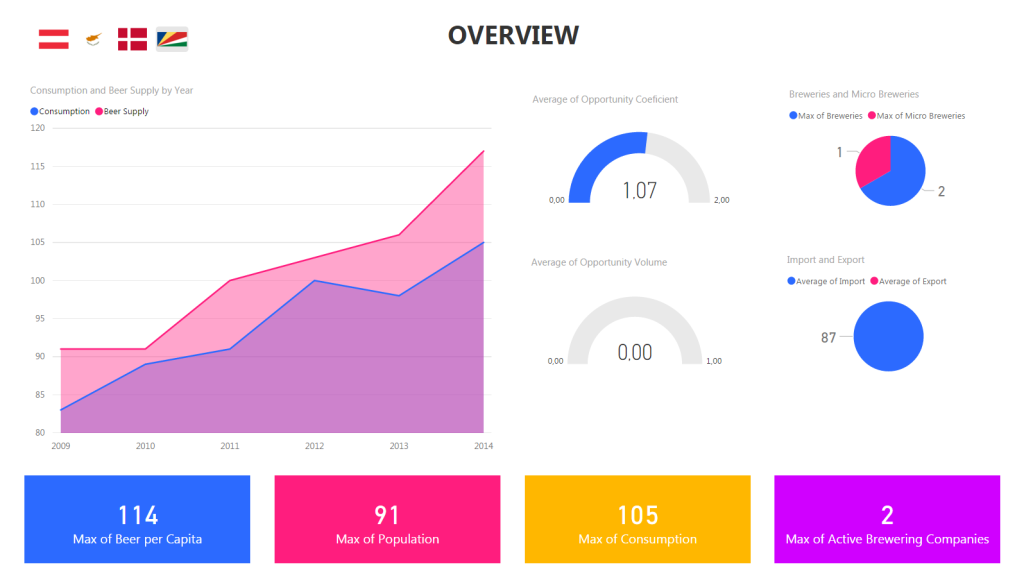
An unexpected finding from this analysis was the potential of the Seychelles market. While 2014 data initially indicated high per capita beer consumption and a seemingly good investment opportunity, deeper investigation revealed market instability and potential future investment losses.
Supporting this, the upper left chart in the above figure shows that beer supply to the Seychelles slightly exceeds consumption, preventing a potential investment failure, making the Austrian market the most feasible business opportunity.
This business story, analyzed using self-service BI technologies, specifically Microsoft Power BI Desktop, serves as a simplified example. However, Power BI Desktop and other market tools offer more complex functionalities to uncover deeper data relationships and often hidden key causes or future effects, which Excel might not reveal.
Ultimately, self-service BI technologies not only save on the costs of busy IT staff but can also prevent significant losses and risks to your business or capitalize on unexpected opportunities. Evaluate what self-service BI tools enable you to do:
- Connect to various heterogeneous data sources and use data in a single consistent model.
- Define your semantic layer to make data accessible to general users, enhance available data with custom calculated attributes, hierarchies, KPIs, and use the semantic layer to translate technical attribute names into user-friendly terms.
- Create interactive dashboards with dynamic sorting, filtering, and aggregating capabilities.
- Process available data with custom transformations in a user-friendly environment, eliminating the need for scripting or macros (user ETL).
- Employ efficient data visualizations and animations.
- Ensure automatic updates of published reports, security, and central administration.
- Publish final reports to a portal and view them through standard web browsers or on mobile devices.
Are you satisfied with your current data management system, or are you considering new possibilities for business analysis and reporting? Try Power BI Desktop in its free version and see if it excites you.